
Published at 2700 × 2160 in Minority Migration in Wabaunsee County, Kansas: A Dark History

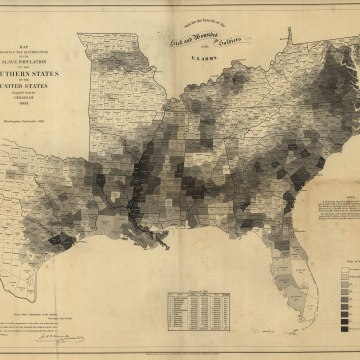
This map, titled, Slave Population of the Southern States of the United States bears a date of September, 1861. It specifies the percentage of slaves in every county.